Infographics: Visualizing Data
Graphic Systems, Spring 2021
This Graphic Systems project involved analyzing four aspects of personal daily life over the span of one month. The data I collected was then used to create four different infographics to display various insights in visually dynamic compositions.
Infographic Design

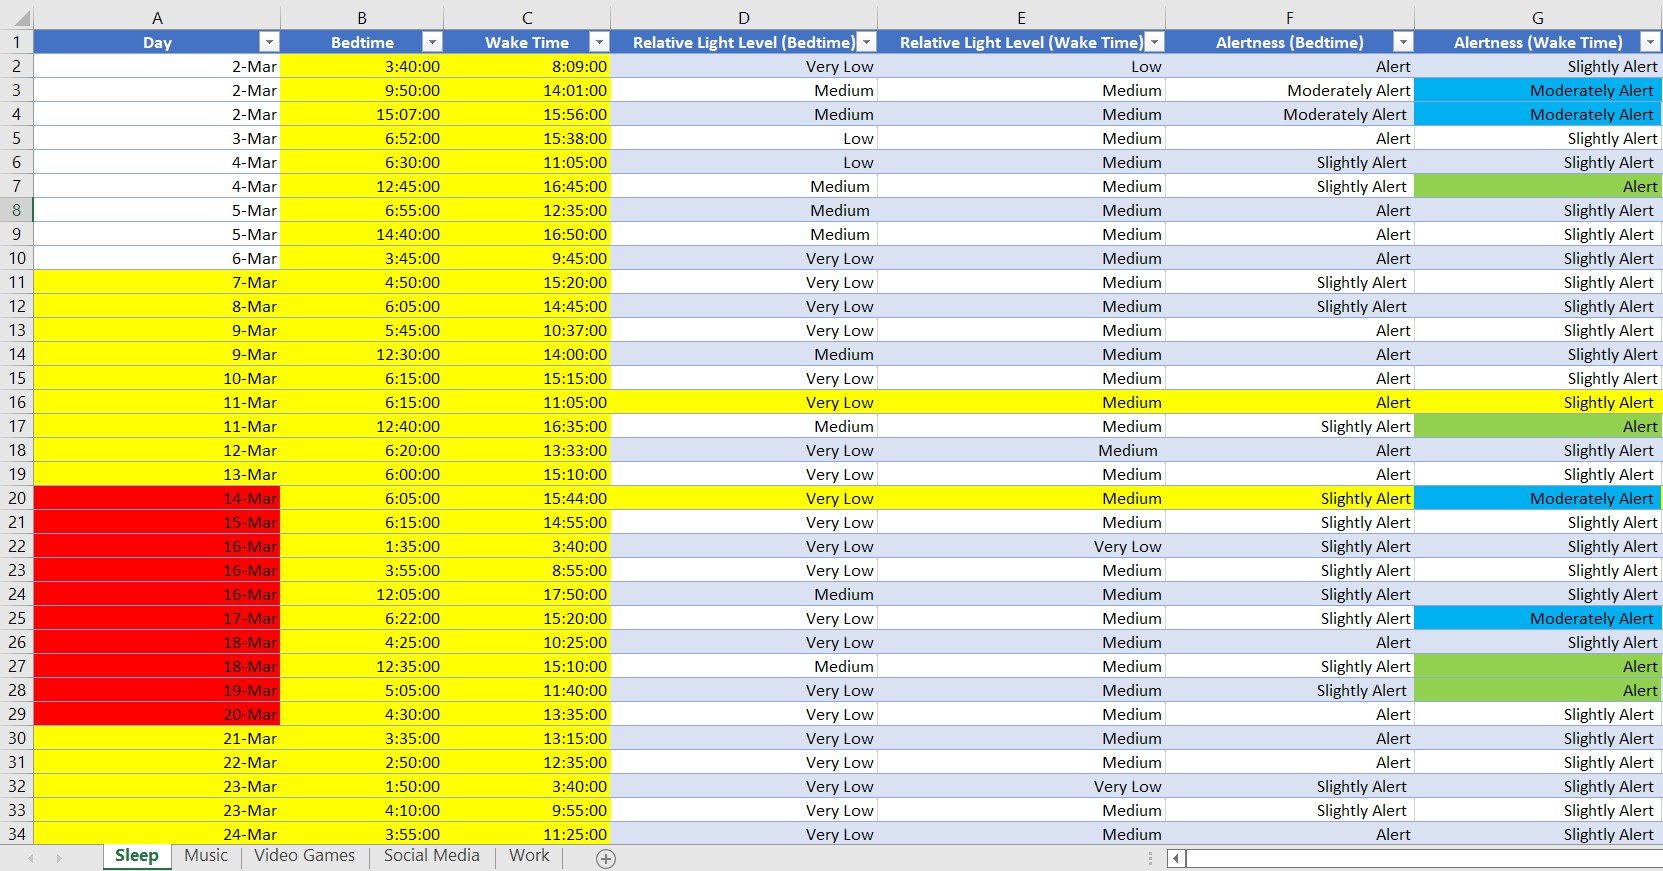
Data Collection
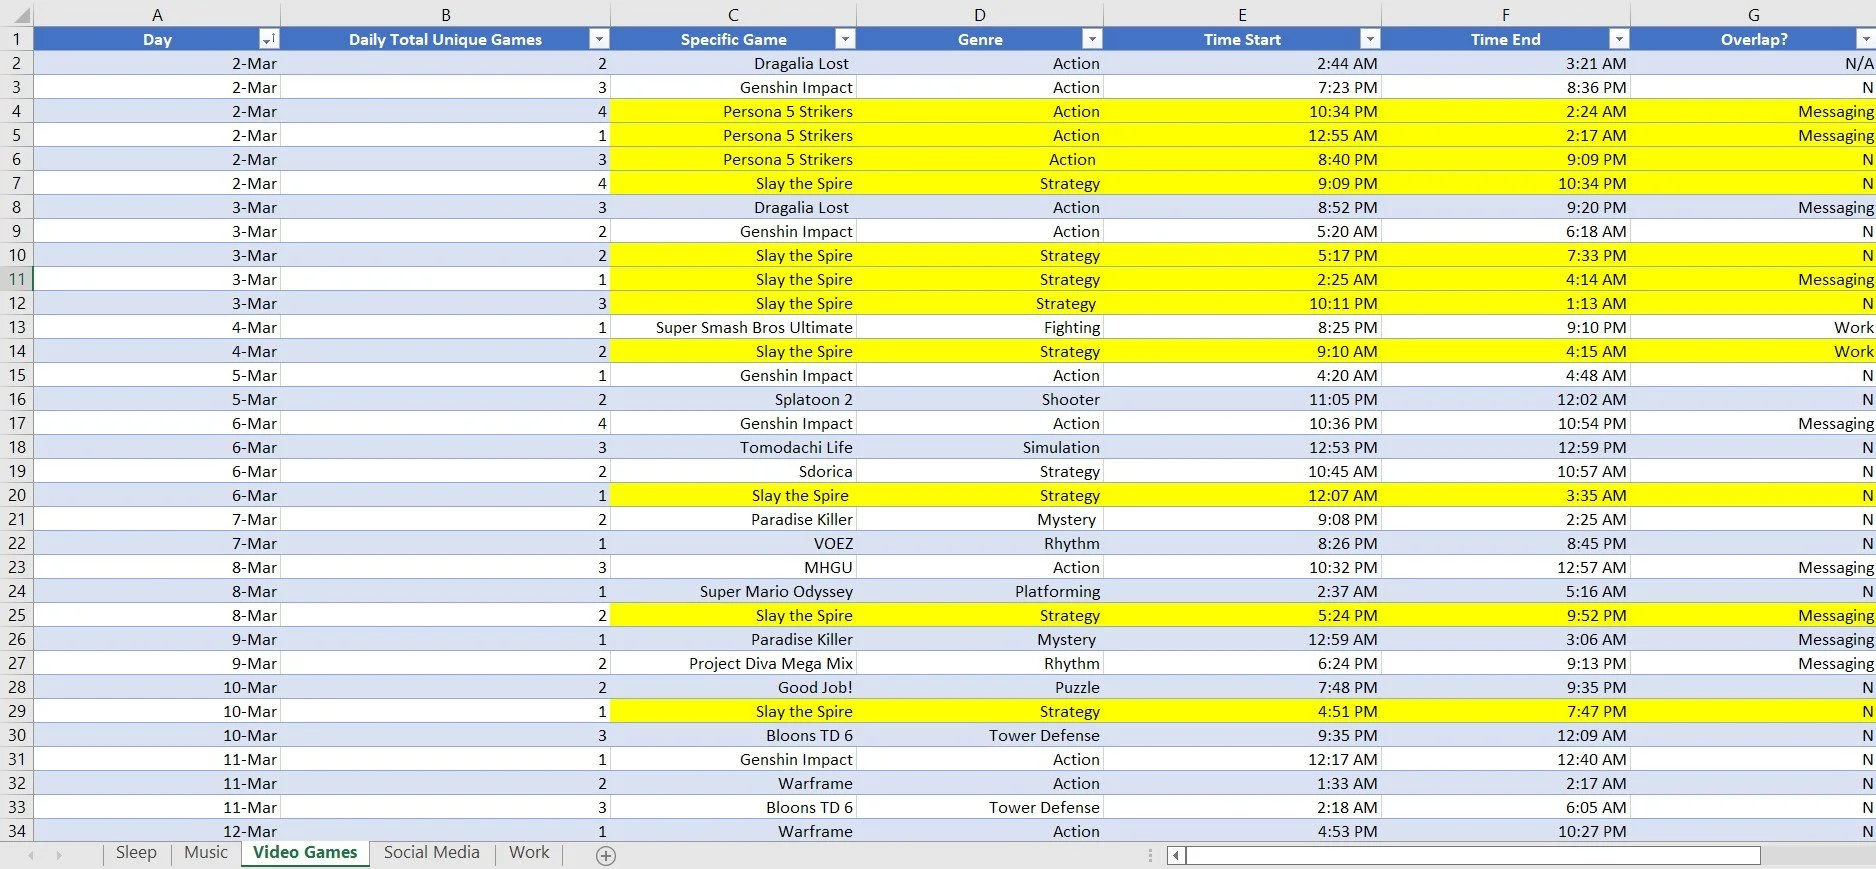
The initial stages of the project involved logging data in four personally chosen aspects of daily life. I chose the categories of sleep, music, video games, and social media. Data was logged in an Excel spreadsheet sorted by filtered columns.
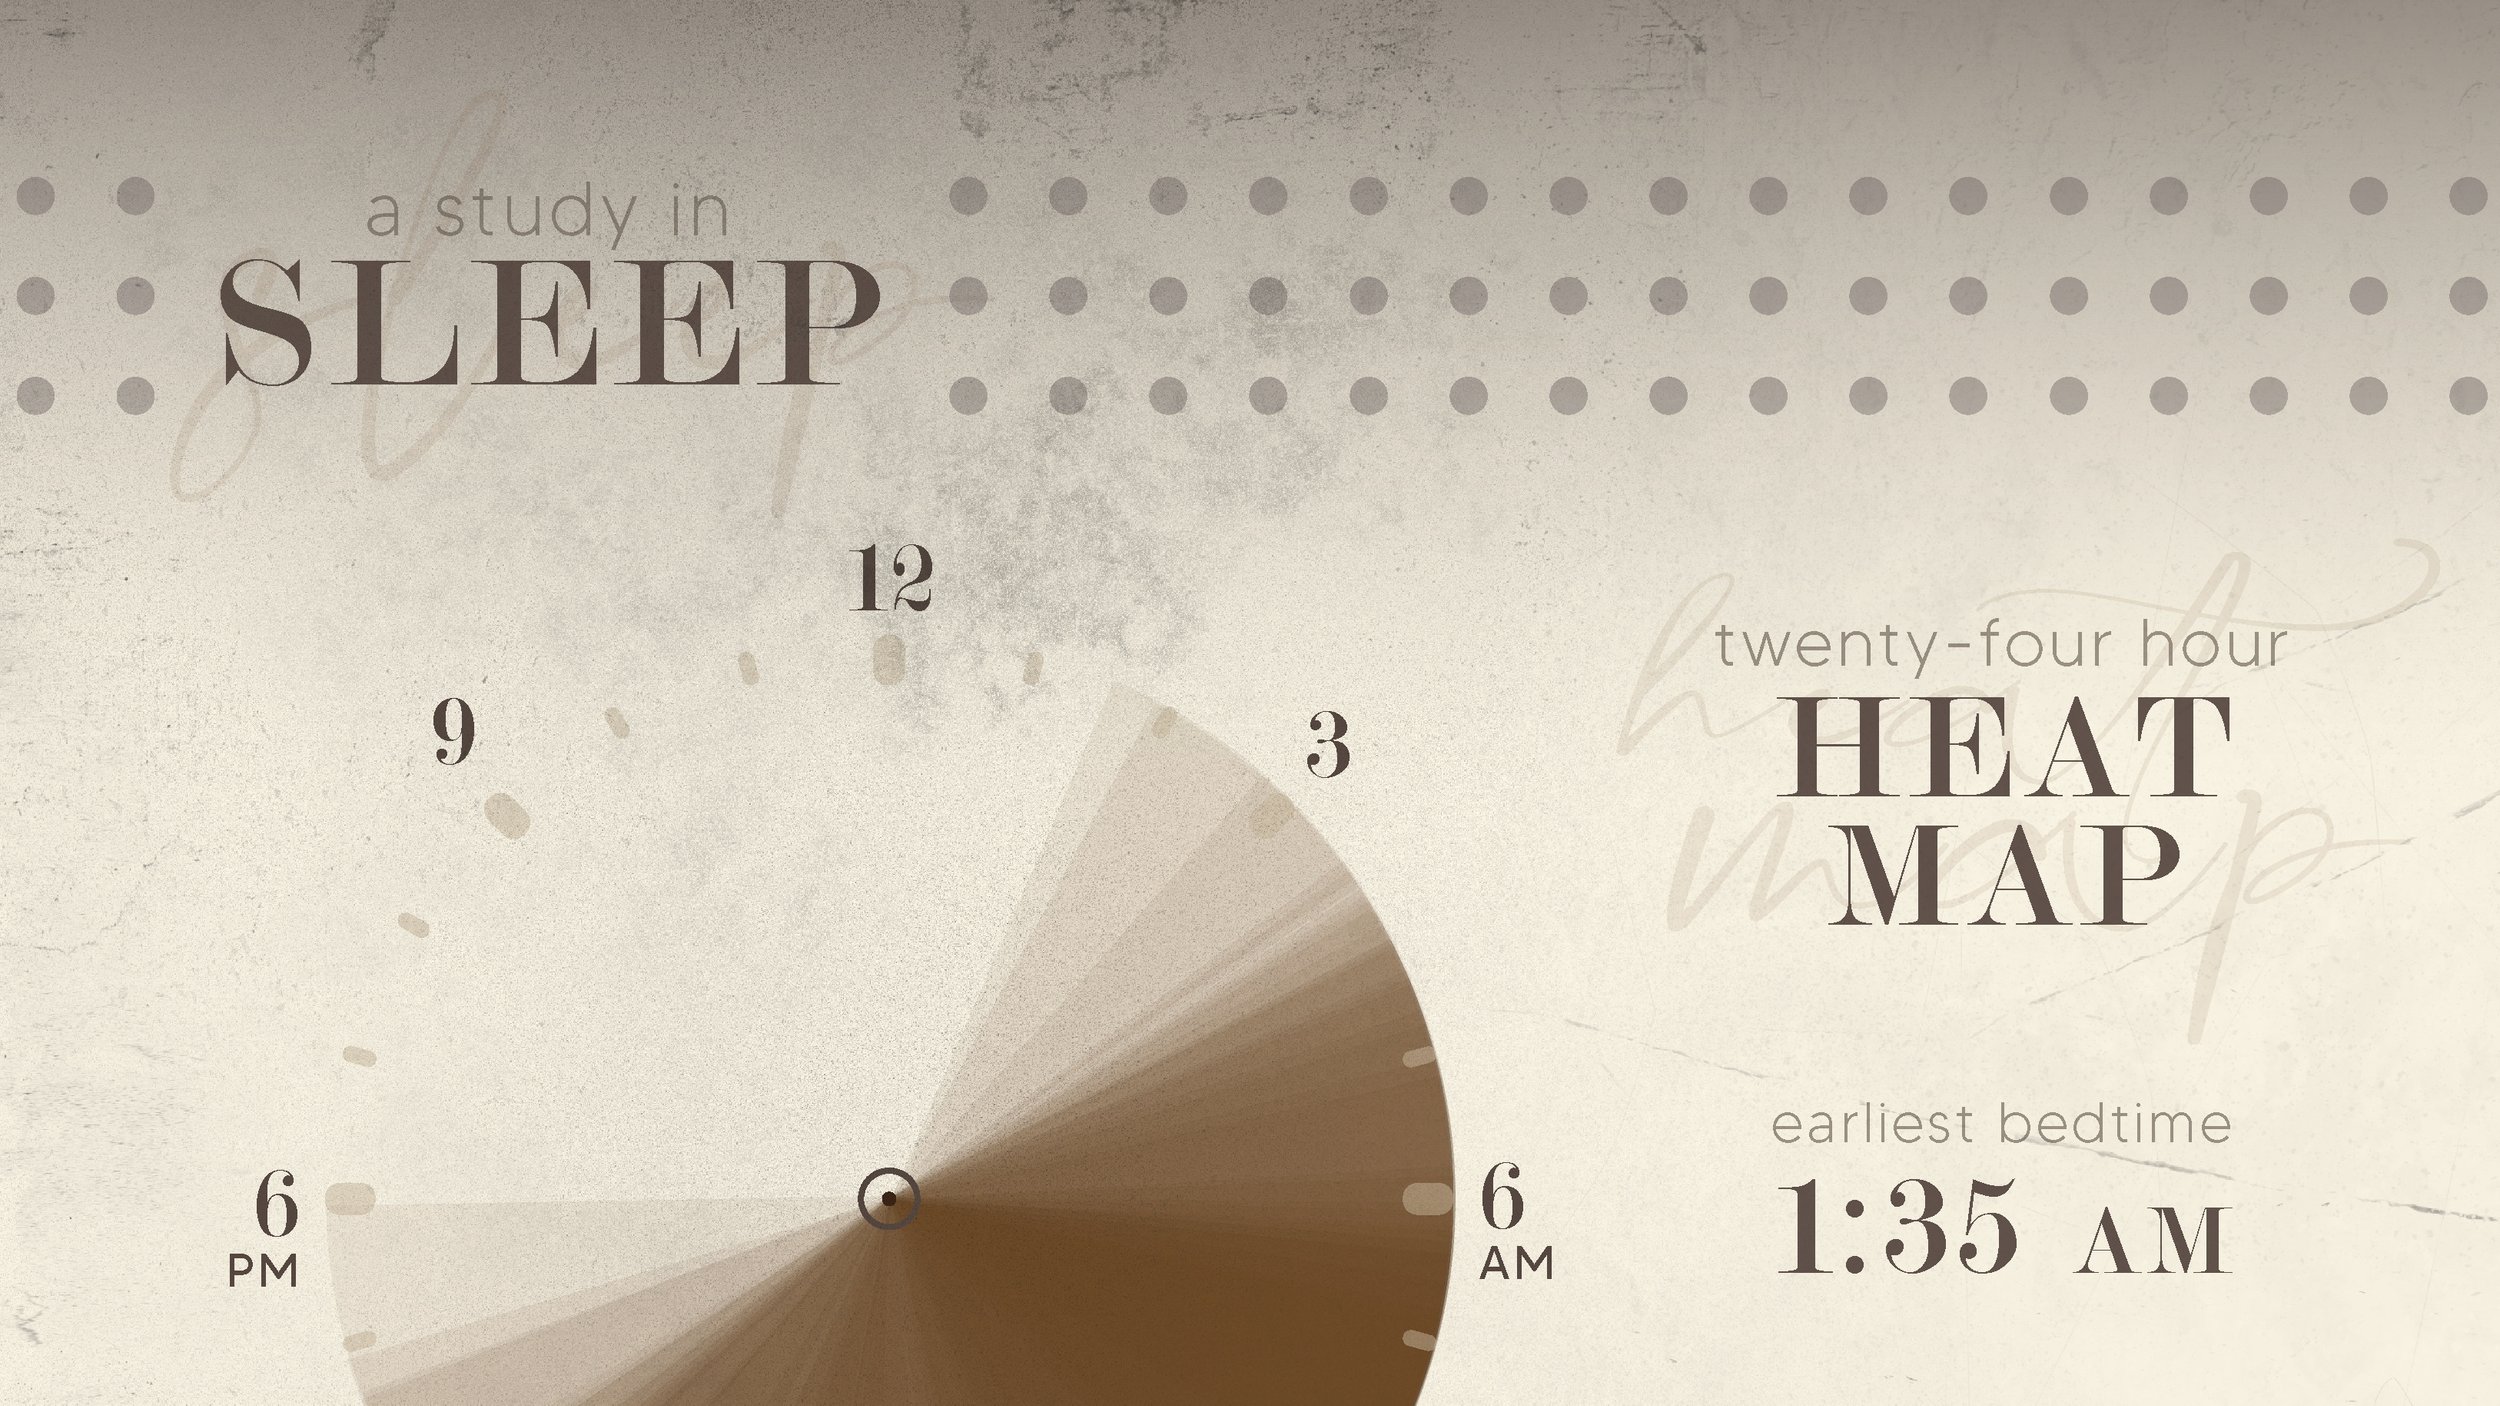
Digital Roughs
After a primary round of traditional sketching, I started on digital rough drafts to establish a cohesive style and different layouts for all four compositions.

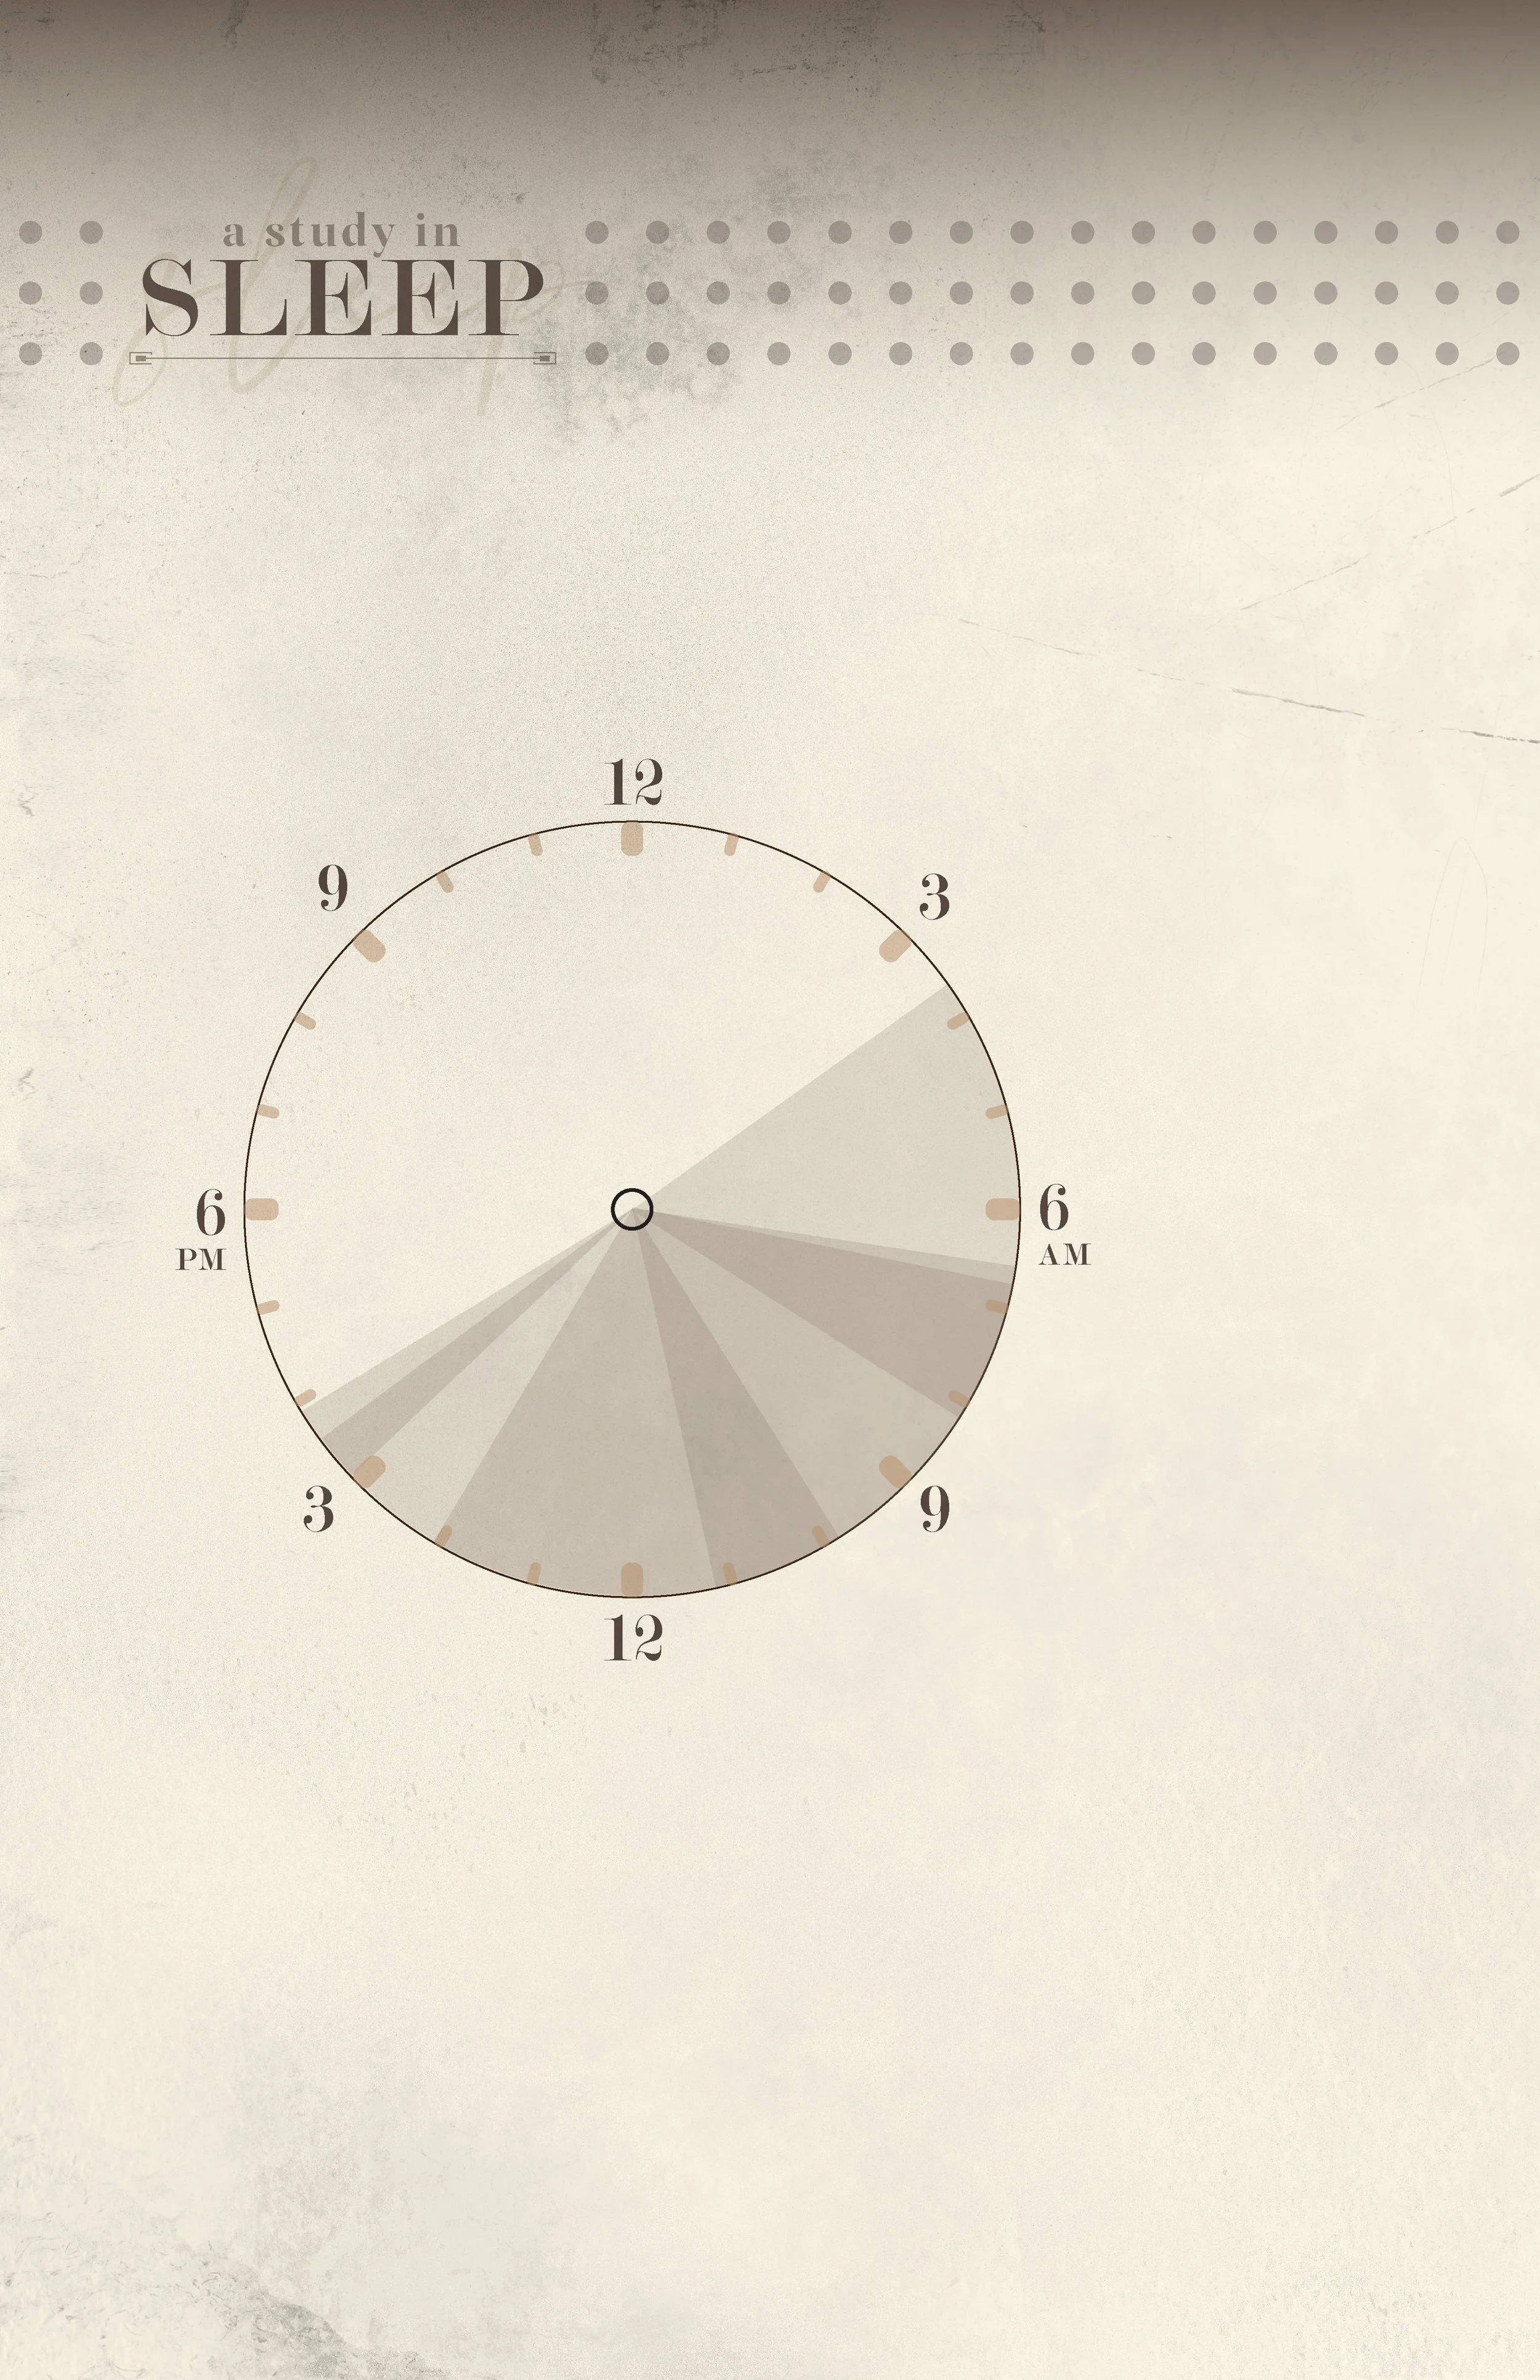
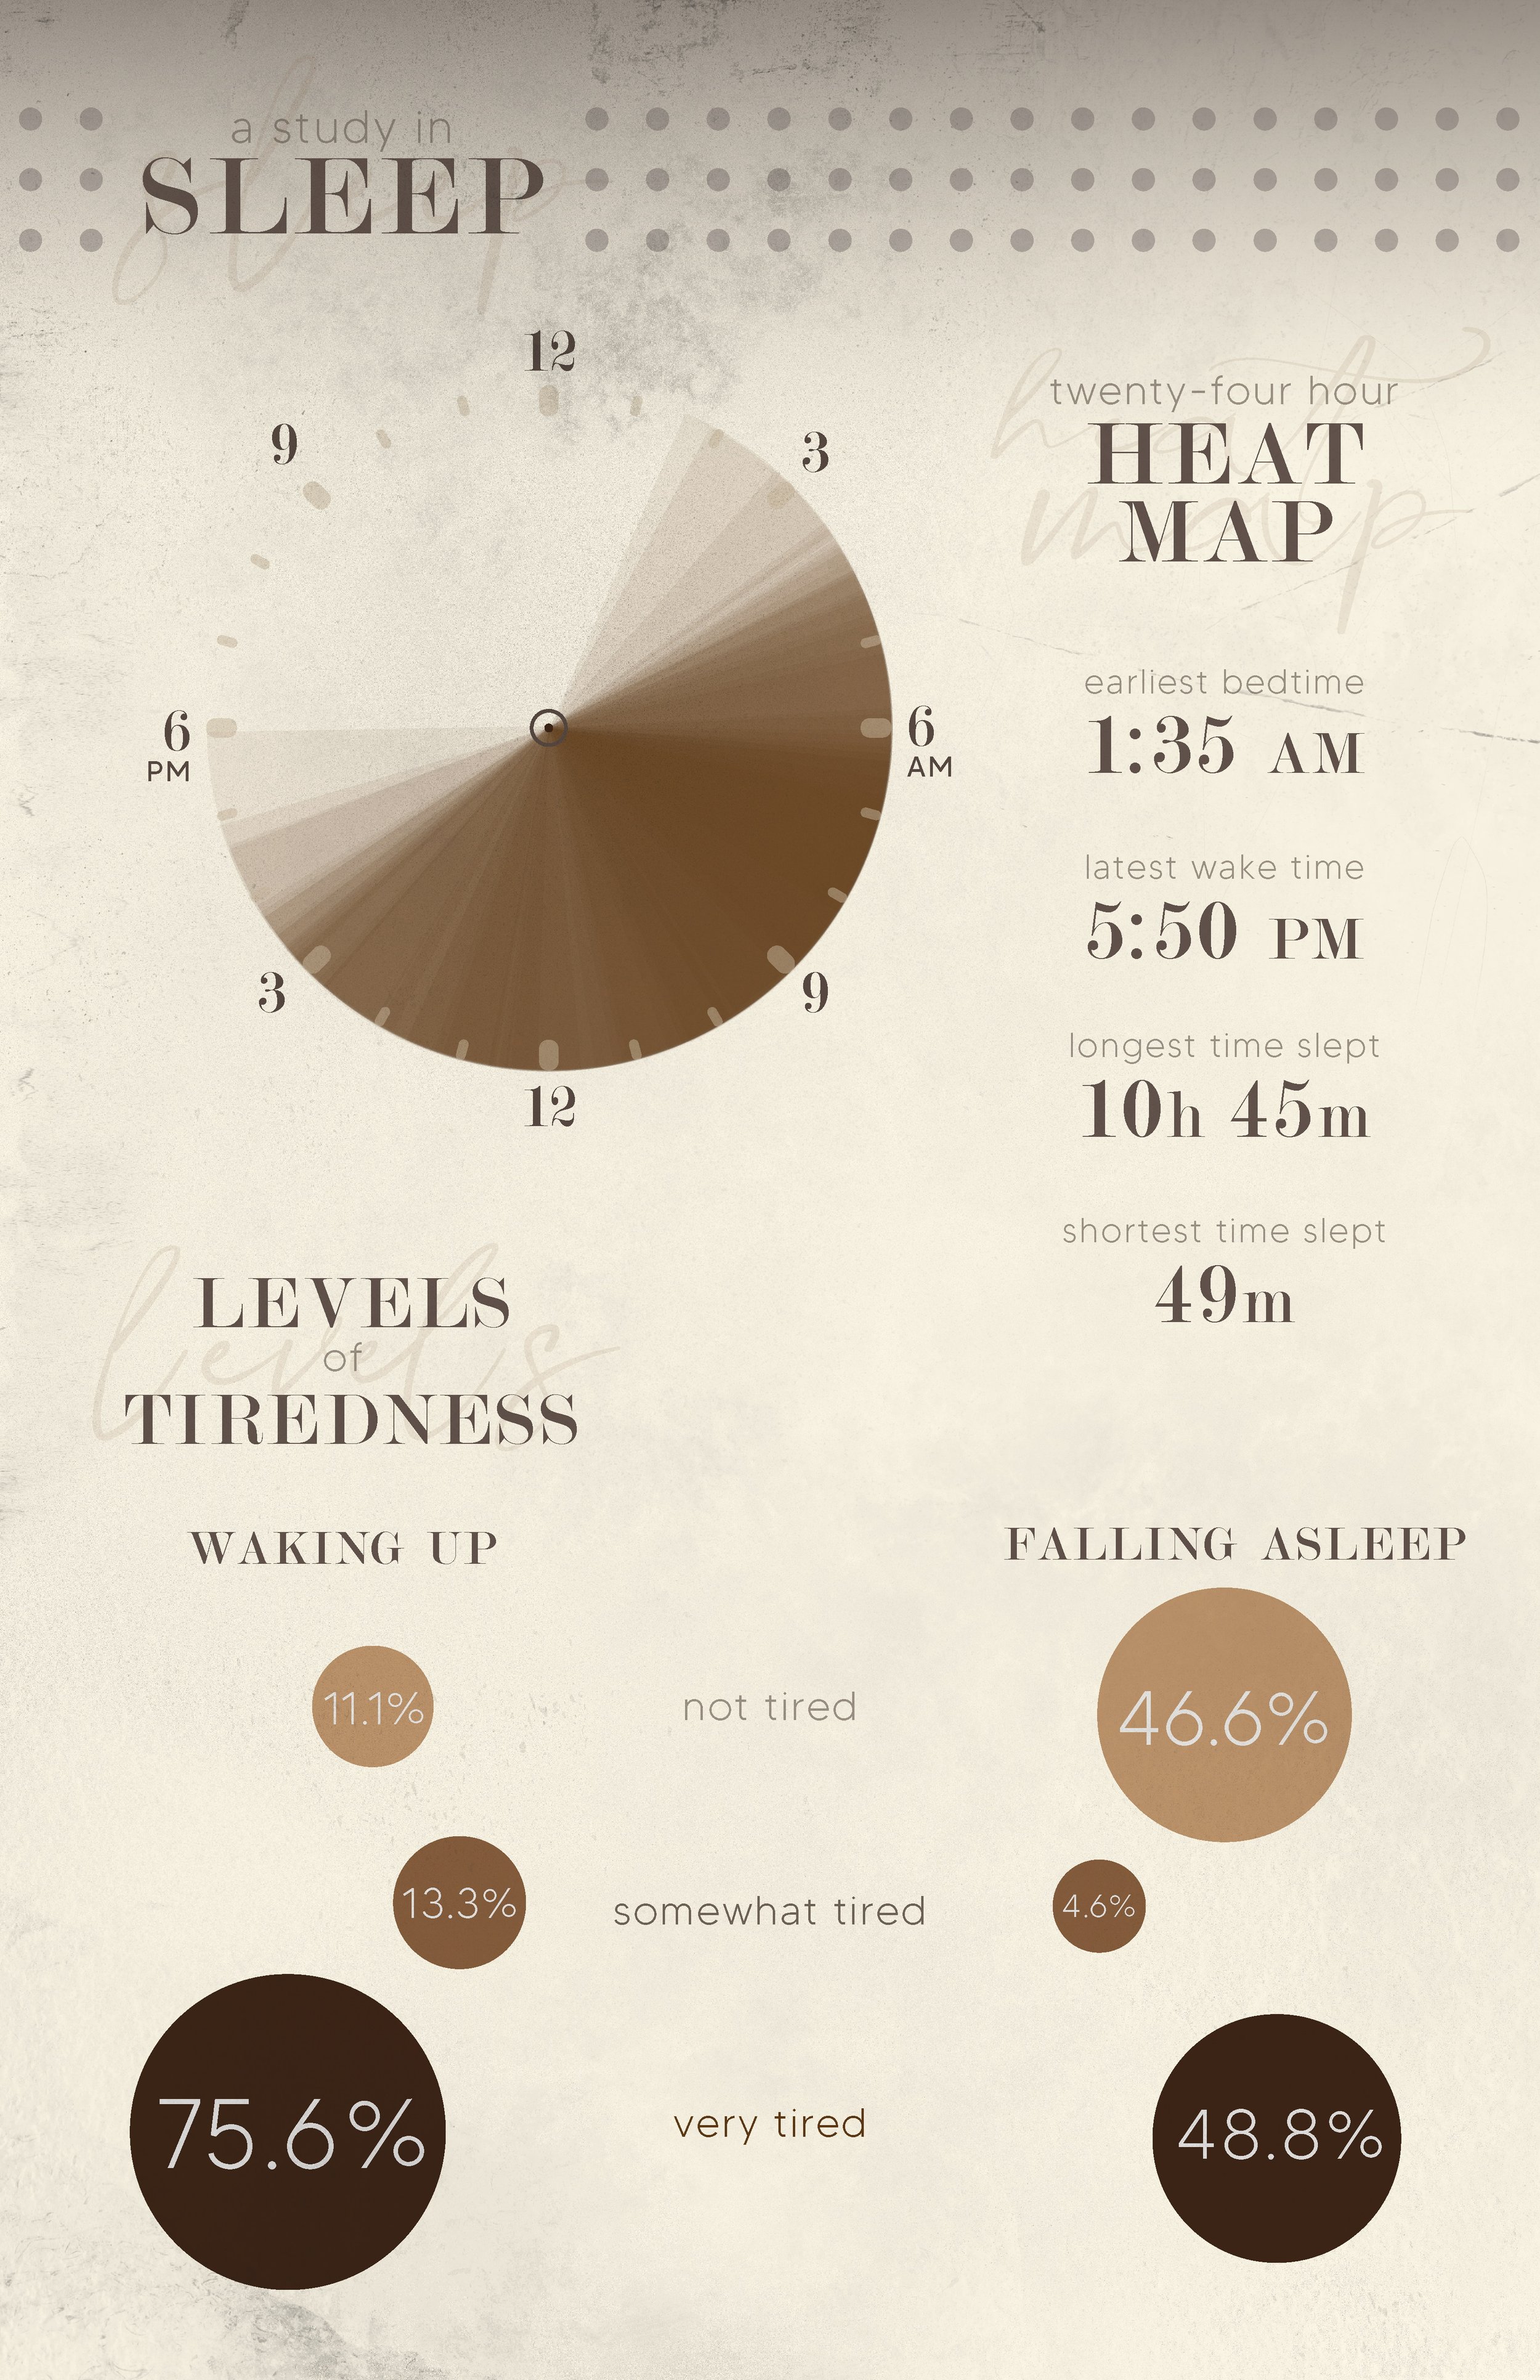
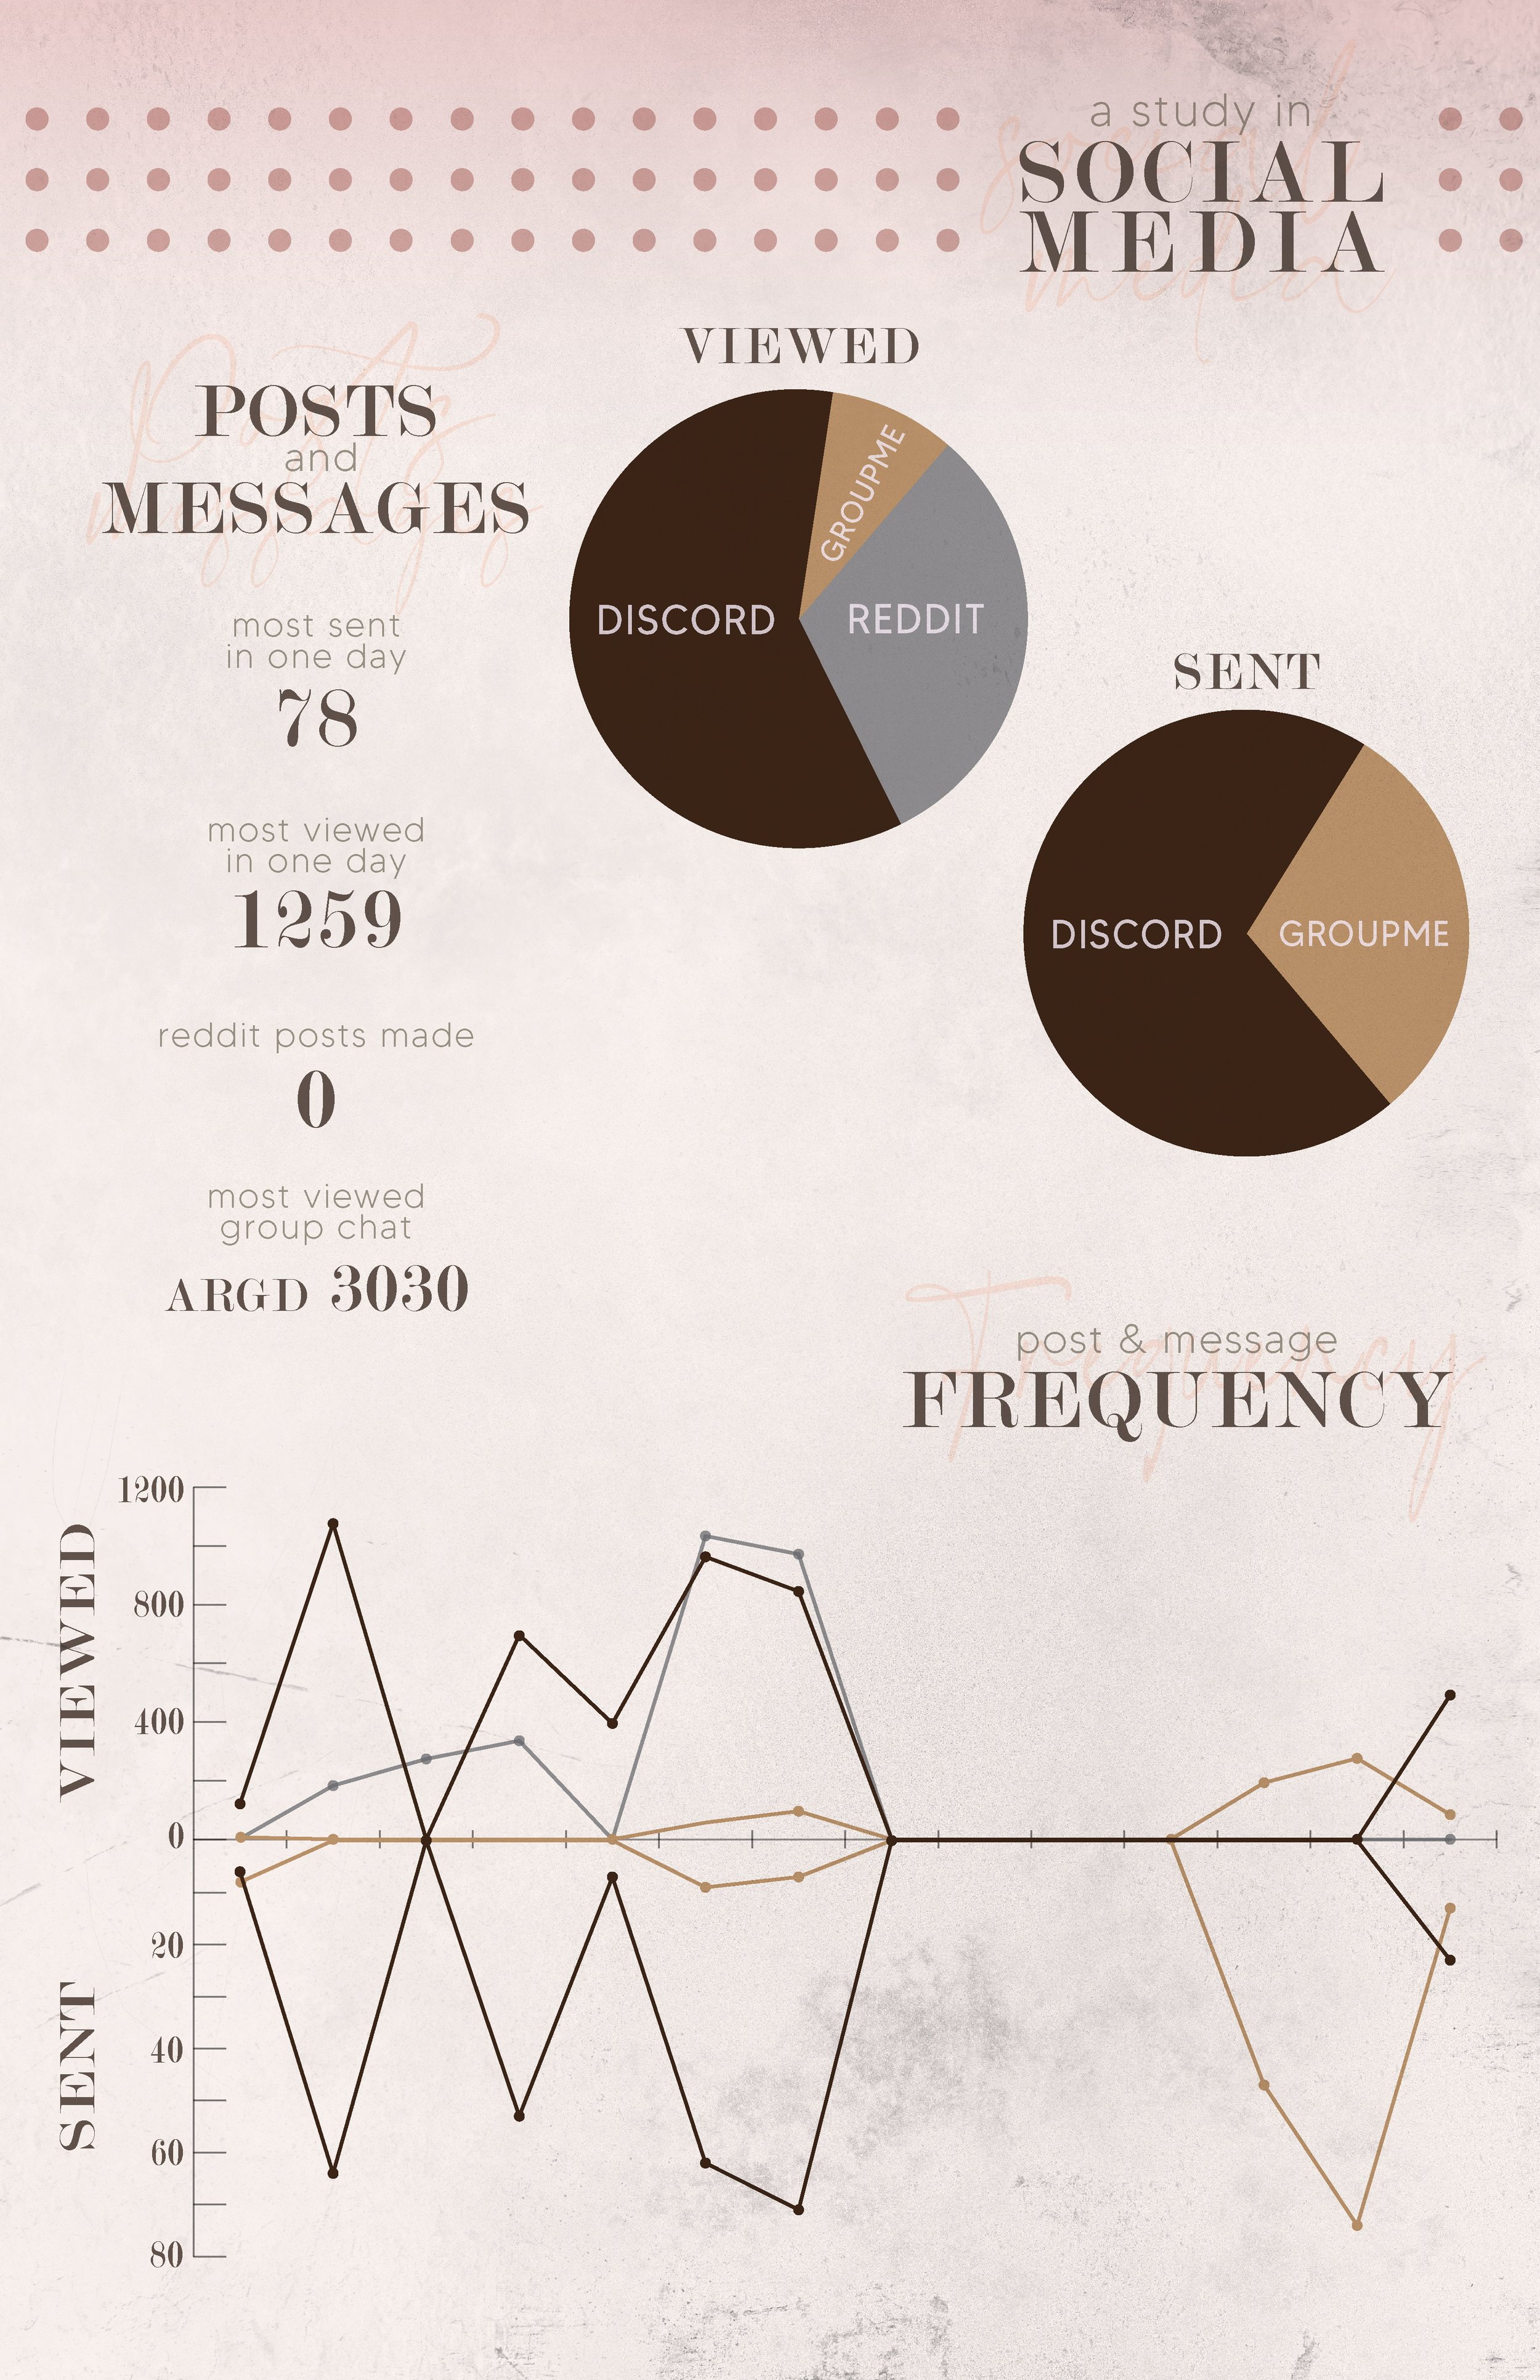
Final Infographics
Following a round of peer review, I created more data visualizations to fill out the rest of the artboards. I then refined my proposed style for maximum consistency across all four compositions and readability in various scales.